
Introduction
Climate change is commonly known to be related to rising sea levels, the loss of glaciers, and record highs in temperature. You and the general public may have noticed the lack of snow and winter season as a whole, and/ or the increased demand of sunscreen and the frequency of solar radiation exposure related skin cancer. Climate change also has a negative effect on the relationship between organisms (i.e. pollinators and plants, predators and prey) (Miller-Rushing, 2019). Issues such as these are tough to communicate because there are many who do not believe in climate change or global warming. This is demonstrated by the shocking amount of public politicians and officials who publicly deny climate change. Communication of climate change is important. Citizen science, the participation of nonspecialists in scientific research, has brought about important contributions to ecology (Miller-Rushing, 2019). Citizen science and science as a whole is benefited when public officials communicate well and truthfully about research and Theories such as climate change. The negative effect climate change has on the ecological relationships is serious. The relationship between organisms is known as phenology. “Phenology is the study of the timing of cyclical events in an organism’s life cycle, such as the flowering of plants, emergence of worker bees from the hive, or the migration of birds.”(Beasley, 2019). When organisms’ phenologies are disrupted due to the changing of environmental cues, an ecological mismatch occurs (Beasley, 2019). Ecological mismatches can result in plants not being pollinated and food shortages for predators, who rely on the emergence of prey. In order to observe climate change’s effect on phenology I organized data retrieved by The United Kingdom Meteorological Office into graphs to visualize new trends in phenology. The data consists of observations of monthly annual temperatures, the first flights of solitary bees, Andrena nigroaenea , and prime flowering times of spider orchids, Ophrys sphegodes. Temperature is the environmental cue that informs the bees when to pollinate and the cue for spider orchids to flower (Beasley, 2019). An ecological mismatch between the solitary bees and spider orchids can lead to the endangerment of both!
Methods
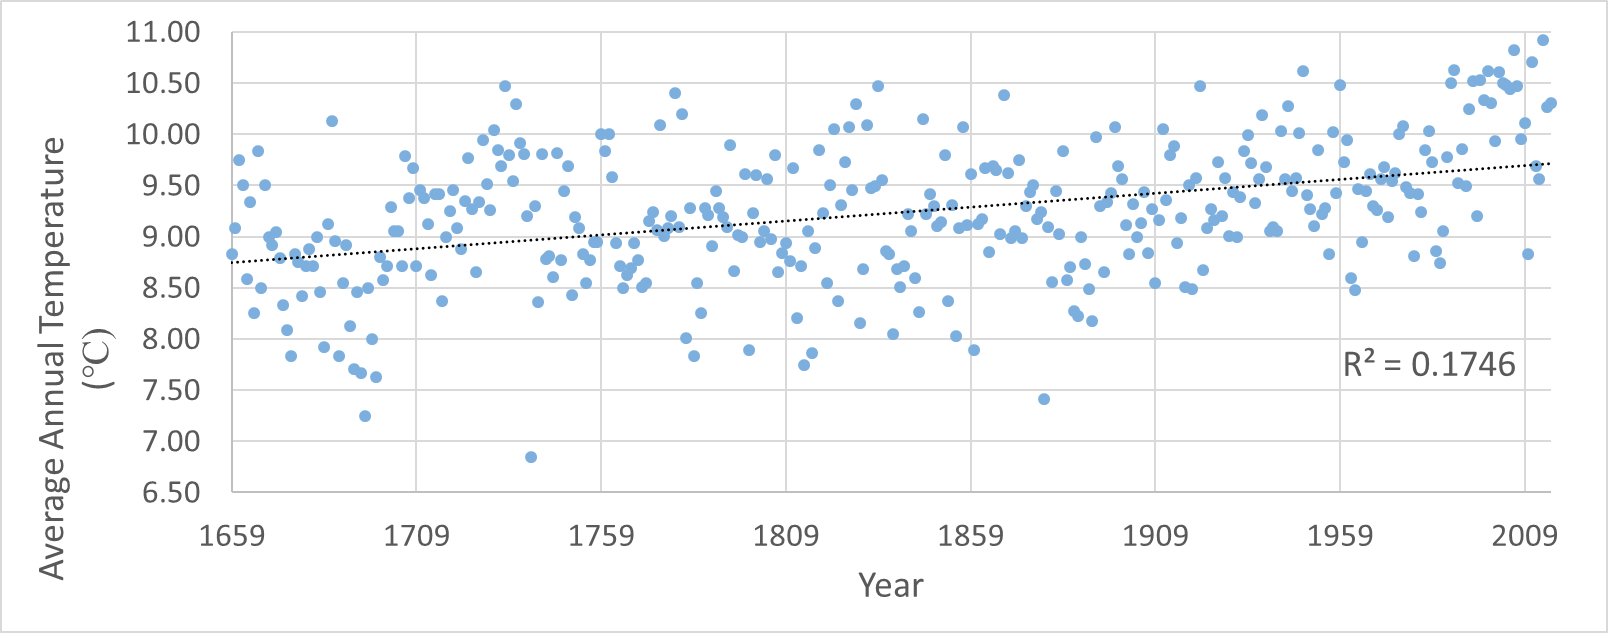
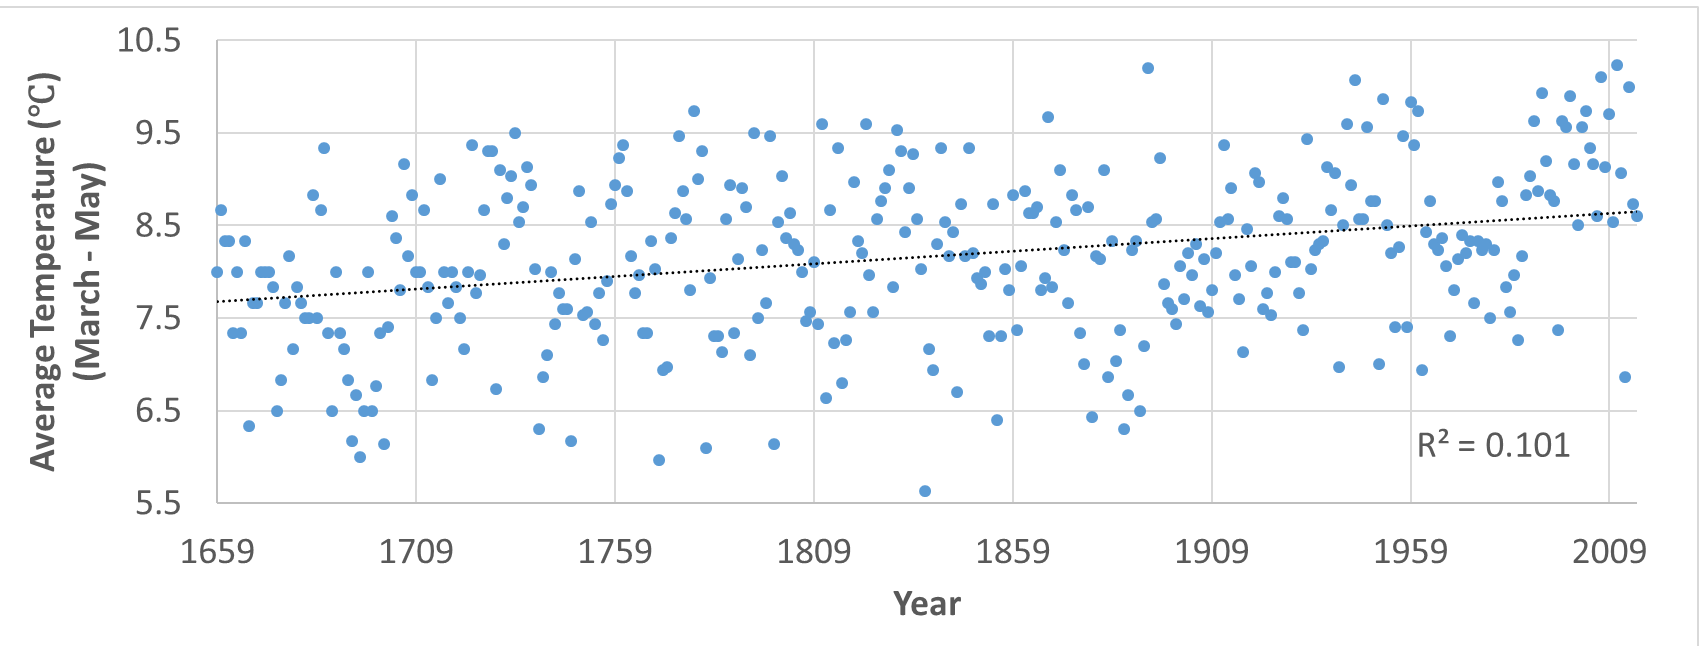
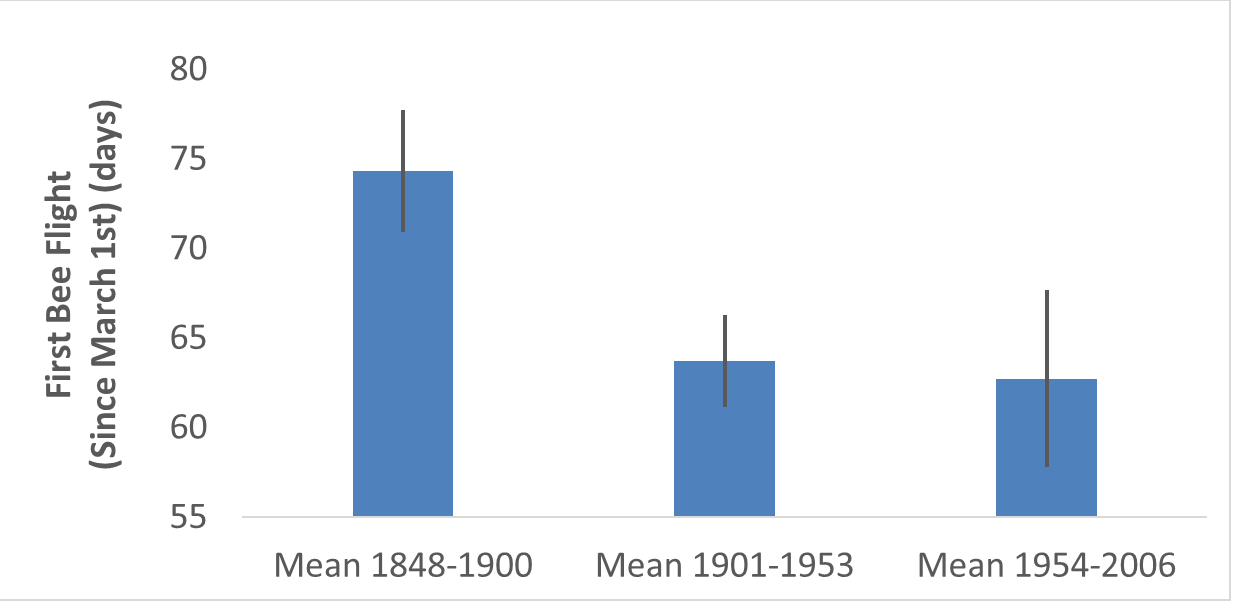
The data measured in this lab was provided by the instructor, Dr. Beasley. The data is mean monthly temperatures from London, Bristol, and Preston. It was collected by researchers (Robbirt et al.) who uploaded the data to the United Kingdom Meteorological Office from 1659 to 2016. Using excel several graphs (scatter plots and bar graphs) were designed to represent the trends and relationships between time and temperature, phenology and temperature, and phenology and time. Coefficients of determination (R^2) were calculated by excel and are used to measure the correlation of data. A R^2 of 1 represents a strong correlation of data and a R^2 of 0 means there is no correlation. The coefficients of determinations can be found in the respecting graph that they represent (figures 1- 4). Using the mean function (sum of data set divided by the number of individuals in a set) averages were calculated. Standard deviations were calculated using excel’s (=STDEV) function. Standard errors were calculated by dividing the standard deviation by the square root of individual data in the set measured. Standard errors can be observed in the following bar graphs (figures 5 and 6).

Credit to https://grist.org/science/why-crushing-bees-into-soup-could-actually-help-them/
Results
Created by William DuBose

Created by William DuBose
Created by William DuBose

Created by William DuBose

Created by William DuBose
Created by William DuBose
Discussion
Following the lab I was provided several questions by the instructor to help discuss and evaluate the lab. I am addressing the questions here. For my scatter plot graphs (Figures 1 – 3) I plotted on the x-axis time (years) and temperature (degrees Celsius) on the y-axis, because the temperatures are dependent on the variable of time and time is independent of temperature. For the scatter plot graph Figure 4 I plotted the temperature (degrees Celsius) on the x-axis and phenology data on the y-axis, because the phenology data is dependent on the temperature. Based on the trend line, in figures 1 – 4 it is obvious that temperatures have been gradually rising over time. The correlation (R²) in figure 2 is 0.087 and the correlation in figure 3 is 0.101. Figure 3 depicts the strongest relationship between temperature and year because the coefficient of determination is greater, closer to 1, but both correlations are similar, almost equal. The timing of the bees compared to the peak flowering time (figure 4) at 7°C ranges from 20 days to 40 days. This means the flowers’ peak flowering times do not occur until several weeks have past after the bees have taken flight. At 10°C there is no comparison because the bees have no recorded flights after 9°C, so this depicts that warmer temperatures have a devastating impact on the both the bees and flowers. Analyzing Figures 5 and 6 it is noticeable that flowering and flight times occur earlier in the year compered to the flowering and flight times at the beginning of the century. Bee flights, on average, occur about 10 days sooner then they did in the beginning of the century. Continued increases in global temperature will affect the reproductive success and abundance/existence of spider orchids. As emergence times of solitary bees and flowering times become more out of synchronicity the spider orchid population will decline due to lack of pollination, and the solitary bee population will also decline due to starvation. Observing figure 4, the majority of bees’ first flights are during cooler temperatures and the majority of spider orchid flowering occurs in warmer temperatures. The split occurs at around 8 degrees Celsius. On a further note, after reading “Brood awakening: Periodical cicadas emerge early” I understand that cicadas have recently been emerging 4 years earlier than before (Sheikh, 2017). Cicadas develop underground and temperature is a key factor to their development (Sheikh, 2017). With more frequent warm weeks a year the cicadas are developing faster and emerging sooner. After performing this lab and noticing the annual warming trends I predict that cicadas will emerge sooner and stay underground for shorter lengths of time compared to previous decades/centuries.

Retrieved from Giphy. Credit to https://www.reddit.com/r/gifs/comments/63d3z6/flower_dying/
References
Miller-Rushing, A. J., Gallinat, A. S., & Primack, R. B. (2019). Creative citizen science illuminates complex ecological responses to climate change. Proceedings of the National Academy of Sciences,116(3), 720-722. doi:10.1073/pnas.1820266116
Beasley, D., Dr. (2019, January). The Effect of Climate Change on Phenology [PDF]. Chattanooga: UTC Learn.
Sheikh, K. (2017). Brood Awakening: 17- Year Cicadas Emerge 4 Years Early. Biology, 1-3. Retrieved February 2, 2019, from https://s3.us-east-1.amazonaws.com/blackboard.learn.xythos.prod/59442bc14e926/10165?response-content-disposition=inline; filename*=UTF-8”PHENOLOGY Periodical cicadas emerge early.pdf&response-content-type=application/pdf&X-Amz-Algorithm=AWS4-HMAC-SHA256&X-Amz-Date=20190204T010545Z&X-Amz-SignedHeaders=host&X-Amz-Expires=21600&X-Amz-Credential=AKIAIL7WQYDOOHAZJGWQ/20190204/us-east-1/s3/aws4_request&X-Amz-Signature=d75cf0065625a301430201dac8d4bb152ca9b829658d2ab803b7df4bccc26a01.
