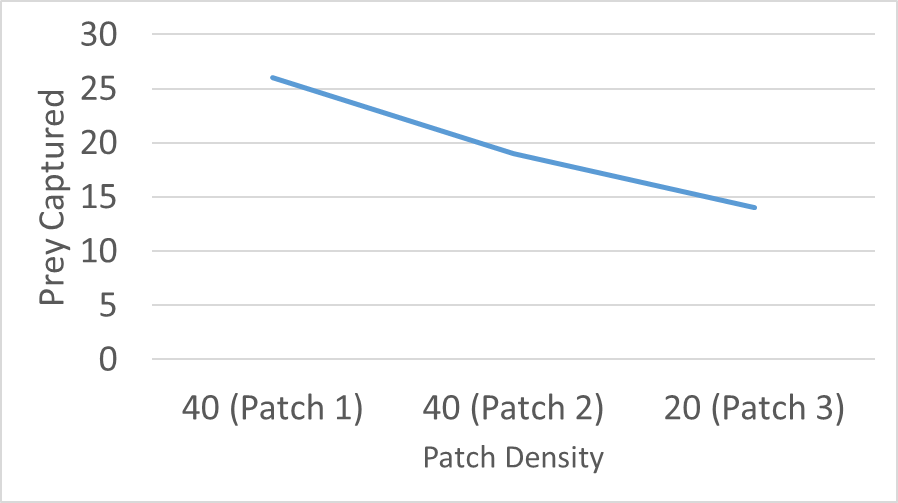
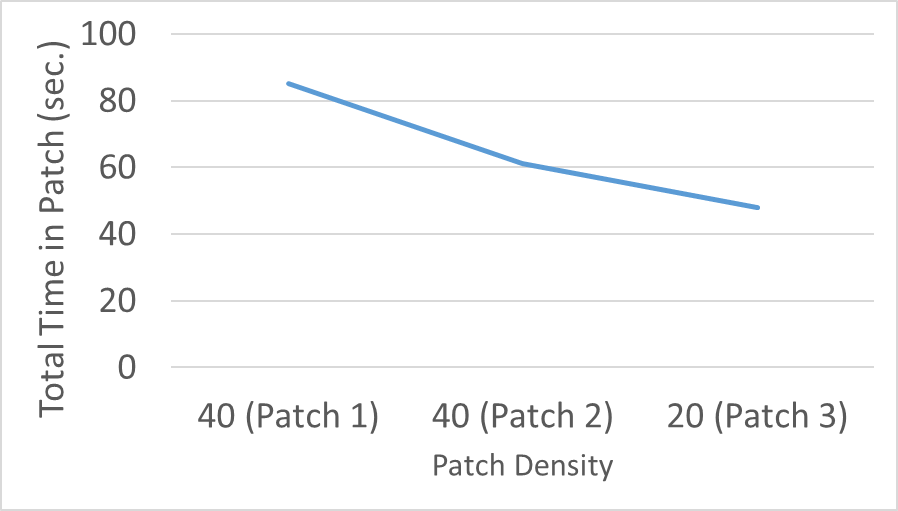
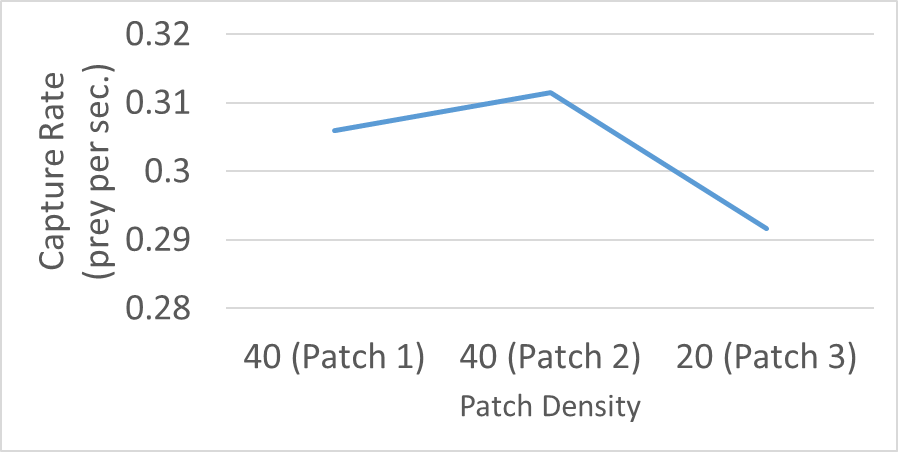
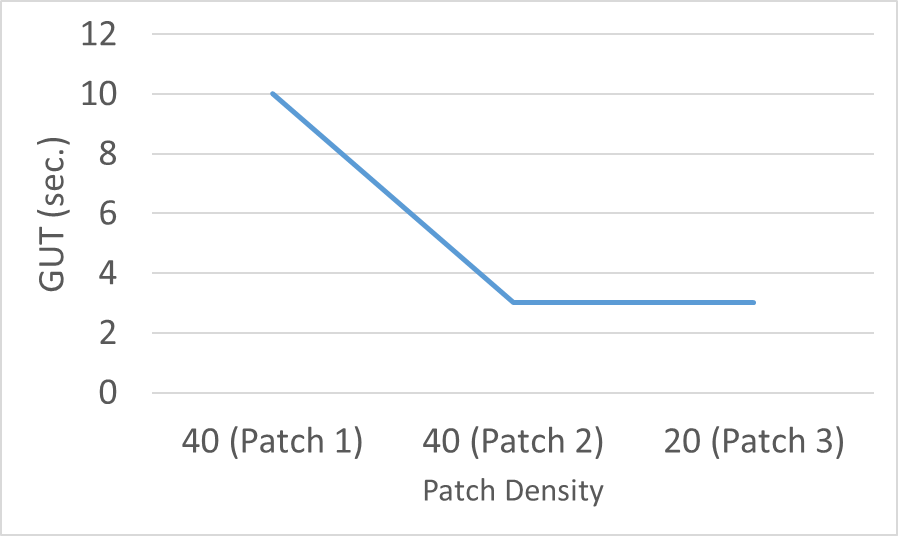
Patches 1 and 3 were good patches and left at optimal times. Patch 2 was left far to soon. The most prey was captured in patch 1 and the fewest in patch 3.The most time was spent in Patch 1 and the least in patch 3. Patch 2 had the best rate of capture and patch 3 had the worst. Less time should have been spent in patch 3 for rate optimization. Give-Up-Time (GUT) was optimized in patches 2 and 3. I should have left patch 1 sooner to optimize GUT.